This tutorial is pure Python and runs from pip install graintrace — open it in Colab:

Comparing two REI point clouds#
REIComparison measures the spatial overlap of two rare-event point clouds (two metrics/thresholds, or a prediction against a reference), even when they sit on grids of different spacing (they must share an origin). It reports IoU, Dice, and containment, matches clusters one-to-one, and writes a classified VTK. Pure Python (numpy + scipy); runs from pip install graintrace.
See :doc:/algorithms/rei-comparison and :class:~graintrace.REIComparison.
[1]:
import numpy as np
import pandas as pd
from graintrace.rei_comparison import REIComparison

import os

os.makedirs("out/rei_cmp", exist_ok=True)
Two clouds of the same blobs at different spacing#
Both clouds sample the same three spheres in physical units; REI 1 uses a 1 um lattice and REI 2 a 2 um lattice. Each sphere is one cluster id.
This is the case the comparator is built for. The two grids have different spacing but share an origin, which is the only registration assumption REIComparison makes – it applies no rotation and no translation, so clouds that are merely near each other will score as disagreeing.
[2]:
import os

os.makedirs("out/rei_cmp", exist_ok=True)


def blobs(extent, spacing, centers, radius):
    """Sample three spheres (physical units) onto a lattice of the given spacing."""
    g = np.arange(0.0, extent, spacing)
    xx, yy, zz = np.meshgrid(g, g, g, indexing="ij")
    rows = []
    for cid, (cx, cy, cz) in enumerate(centers, start=1):
        m = (xx - cx) ** 2 + (yy - cy) ** 2 + (zz - cz) ** 2 <= radius * radius
        rows.append(
            pd.DataFrame(
                {"x": xx[m], "y": yy[m], "z": zz[m], "rare_cluster_id": cid}
            )
        )
    return pd.concat(rows, ignore_index=True)


extent = 40.0
centers = [(10.0, 10.0, 10.0), (25.0, 25.0, 20.0), (15.0, 30.0, 30.0)]
df1 = blobs(extent, 1.0, centers, radius=6.0)   # fine grid, 1 um
df2 = blobs(extent, 2.0, centers, radius=6.0)   # coarse grid, 2 um, same spheres
df1.to_csv("out/rei_cmp/rei_A.csv", index=False)
df2.to_csv("out/rei_cmp/rei_B.csv", index=False)
print("REI 1 points:", len(df1), "| REI 2 points:", len(df2))
REI 1 points: 2775 | REI 2 points: 345
Run the comparison#
[3]:
comp = REIComparison(
    rei_csv_1="out/rei_cmp/rei_A.csv", rei_csv_2="out/rei_cmp/rei_B.csv",
    output_dir="out/rei_cmp",
    spacing_1=1.0, spacing_2=2.0,
    coord_cols=("x", "y", "z"),
    cluster_col="rare_cluster_id",
)
result = comp.run_comparison()
m = result["overlap_metrics"] if "overlap_metrics" in result else result
for k in ("iou", "dice", "containment_1", "containment_2"):
    if k in m:
        print(f"{k:15} {m[k]:.3f}")
Loaded 2775 points (REI 1) and 345 points (REI 2).
Grid geometry:
  spacing_1 = [1. 1. 1.]
  spacing_2 = [2. 2. 2.]
  s_ref     = [1. 1. 1.] (supersample=1)
  origin    = [4. 4. 4.]

=== REI Comparison Metrics ===
  s_ref                   : [1.0, 1.0, 1.0]
  voxel_volume            : 1.0
  n_voxels_1              : 2775
  n_voxels_2              : 2527
  n_voxels_intersection   : 2277
  n_voxels_union          : 3025
  volume_1                : 2775.0
  volume_2                : 2527.0
  volume_intersection     : 2277.0
  volume_union            : 3025.0
  iou                     : 0.7527272727272727
  dice                    : 0.8589211618257261
  containment_1           : 0.8205405405405405
  containment_2           : 0.9010684606252474
Saved metrics: /home/runner/work/graintrace/graintrace/docs/tutorials/out/rei_cmp/overlap_metrics.json

Cluster matching: 3 matched (3 in REI 1, 3 in REI 2); splits=0, merges=0.
Saved cluster match table: /home/runner/work/graintrace/graintrace/docs/tutorials/out/rei_cmp/cluster_match.csv
Saved classified overlap cloud: /home/runner/work/graintrace/graintrace/docs/tutorials/out/rei_cmp/overlap_cloud.vtk
What the numbers mean#
All four metrics are computed on a common lattice: both clouds are resampled onto the finer spacing \(s_{\mathrm{ref}} = \min(s_1, s_2)\) and the overlap is an exact integer-index intersection, so there is no tolerance and no nearest-neighbour matching involved.
IoU and Dice are symmetric and answer “do these agree?”. The two containments are not, and they are the pair that tells you how they disagree: a high \(\mathrm{containment}_1\) with a low \(\mathrm{containment}_2\) means region 1 sits inside region 2, which is the signature of one criterion being strictly more permissive rather than simply wrong.
Cluster-to-cluster matching#
Global overlap says whether the two regions coincide; it does not say whether they decomposed the region the same way. cluster_match.csv pairs clusters one-to-one by maximising total overlap volume (Hungarian assignment), so the pairing is label-agnostic — cluster 3 in one run can legitimately be cluster 1 in the other. Unmatched clusters are flagged -1, which is how a split or a merge shows up.
[4]:
match = pd.read_csv("out/rei_cmp/cluster_match.csv")
print(match.to_string(index=False))
 cluster_1  cluster_2  overlap_voxels  overlap_volume  size_voxels_1  size_voxels_2  jaccard  containment_1  containment_2
         1          1             709           709.0            925            739 0.742408       0.766486       0.959405
         2          2             820           820.0            925            960 0.769953       0.886486       0.854167
         3          3             748           748.0            925            828 0.744279       0.808649       0.903382
Seeing the overlap#
overlap_cloud.vtk carries a membership scalar on the common lattice: 1 = only in REI 1, 2 = only in REI 2, 3 = in both. ParaView is the natural viewer, but one slice through the classified cloud makes the point here.
The disagreement is a boundary effect, and it goes both ways. The coarse cloud’s voxels are 2 um cubes, so near the sphere surface each one either sticks out past the fine cloud’s edge (only 2) or fails to reach it (only 1). Interior voxels agree exactly. That is the characteristic signature of a pure resolution difference, as opposed to two criteria flagging genuinely different places – which would show up as whole clusters unmatched in the table above.
[5]:
import matplotlib.pyplot as plt
import pyvista as pv

cloud = pv.read("out/rei_cmp/overlap_cloud.vtk")
pts = np.asarray(cloud.points)
mem = np.asarray(cloud["membership"]).astype(int)

zc = 10.0
sel = pts[:, 2] == zc
labels = {1: ("only REI 1", "tab:blue"), 2: ("only REI 2", "tab:red"), 3: ("both", "tab:green")}

fig, ax = plt.subplots(figsize=(5.2, 5))
for key, (lab, col) in labels.items():
    m = sel & (mem == key)
    ax.scatter(pts[m, 0], pts[m, 1], s=16, c=col, label=f"{lab} ({int(m.sum())})")
ax.set_aspect("equal")
ax.set_xlabel("x [um]")
ax.set_ylabel("y [um]")
ax.set_title(f"overlap_cloud.vtk membership, z = {zc:g} um slice")
ax.legend(loc="upper left", fontsize=8)
fig.tight_layout()
/opt/hostedtoolcache/Python/3.11.17/x64/lib/python3.11/site-packages/tqdm/auto.py:21: TqdmWarning: IProgress not found. Please update jupyter and ipywidgets. See https://ipywidgets.readthedocs.io/en/stable/user_install.html
  from .autonotebook import tqdm as notebook_tqdm
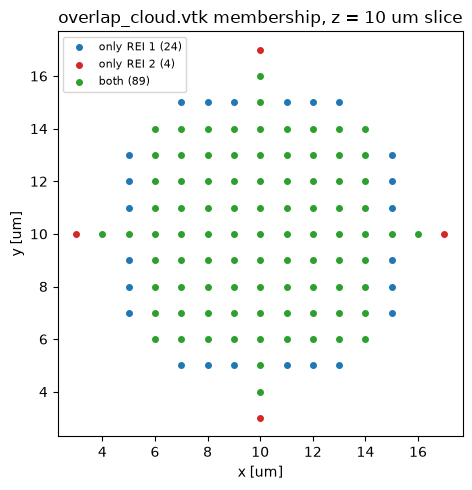
The two clouds cover the same blobs, so IoU/Dice are high. output_dir also gets overlap_metrics.json, a classified overlap_cloud.vtk (only-1 / only-2 / both), and cluster_match.csv (the one-to-one cluster pairing).
See also
Algorithm: :doc:
/algorithms/rei-comparisonProducing REI point clouds: :doc:
rare-event-identification