
 NEML2
Grinding example#
This notebook runs the fragmentation population balance model defined in
grinding.i and plots the two things a grinding model is expected to show:
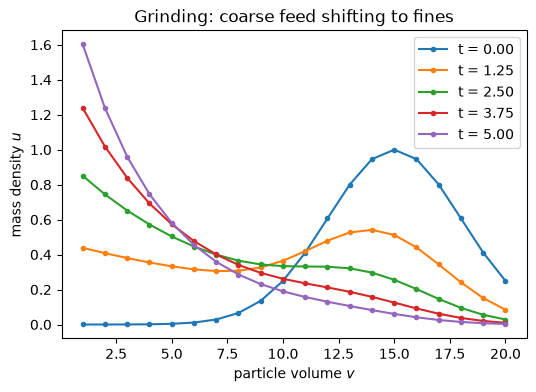
the size distribution shifting from the coarse feed toward the fines, and
conservation of total mass. The model, its math, and a walkthrough of the
input file are described on the Population balance (fragmentation) page.
Breakage model#
This example fixes the two constitutive choices (see Population balance (fragmentation) for the population balance equation and the flux operator derivation):
Fragmentation rate – increasing with size, with a sink at the smallest bin, \(\gamma_i = 0.05\, i\) (so \(\gamma_0 = 0\)).
Daughter distribution – each parent splits its mass equally over all smaller bins, \(p_{kj} = v_j / (j\, v_k)\) for \(k < j\), which conserves mass at uniform density.
%matplotlib inline
import matplotlib.pyplot as plt
import torch

import neml2

torch.set_default_dtype(torch.float64)
Load the input file, fetch the TransientDriver, and run the transient. driver.result() returns a flat dict of per step buffers keyed output.<step>.u.
factory = neml2.load_input("grinding.i")
driver = factory.get_driver("driver")
driver.run()
res = driver.result()

# Bin volumes and time axis match the [Tensors] block in grinding.i.
v = torch.arange(1.0, 21.0)
time = torch.linspace(0.0, 5.0, 25)
steps = sorted(int(k.split(".")[1]) for k in res if k.startswith("output.") and k.endswith(".u"))
u = torch.stack([res[f"output.{s}.u"].detach().reshape(-1) for s in steps])
u.shape
torch.Size([25, 20])
Size distribution evolution#
The coarse Gaussian feed (centered at bin 14) breaks into smaller bins over time; mass accumulates in the low volume sink.
fig, ax = plt.subplots(figsize=(6, 4))
for s in [0, 6, 12, 18, 24]:
    ax.plot(v, u[s], marker="o", ms=3, label=f"t = {time[s]:.2f}")
ax.set_xlabel("particle volume $v$")
ax.set_ylabel("mass density $u$")
ax.set_title("Grinding: coarse feed shifting to fines")
ax.legend()
plt.show()
Mass conservation#
The finite-volume flux form with zero-flux boundaries conserves total mass \(\sum_i u_i\,\Delta v_i\) (here \(\Delta v_i = 1\)) to solver tolerance at every step.
mass = u.sum(dim=1)
fig, ax = plt.subplots(figsize=(6, 4))
ax.plot(time, mass, marker="o", ms=3)
ax.set_xlabel("time")
ax.set_ylabel(r"total mass  $\sum_i u_i \Delta v_i$")
ax.set_title("Total mass is conserved")
ax.set_ylim(float(mass.min()) * 0.99, float(mass.max()) * 1.01)
plt.show()
print(f"relative mass drift: {(mass.max() - mass.min()) / mass[0]:.2e}")
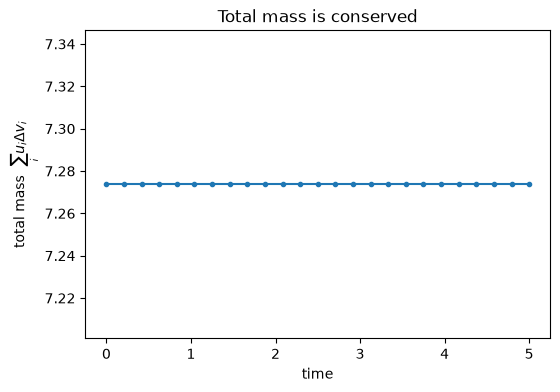
relative mass drift: 2.44e-16